Veeva COVID-19 report | infographic
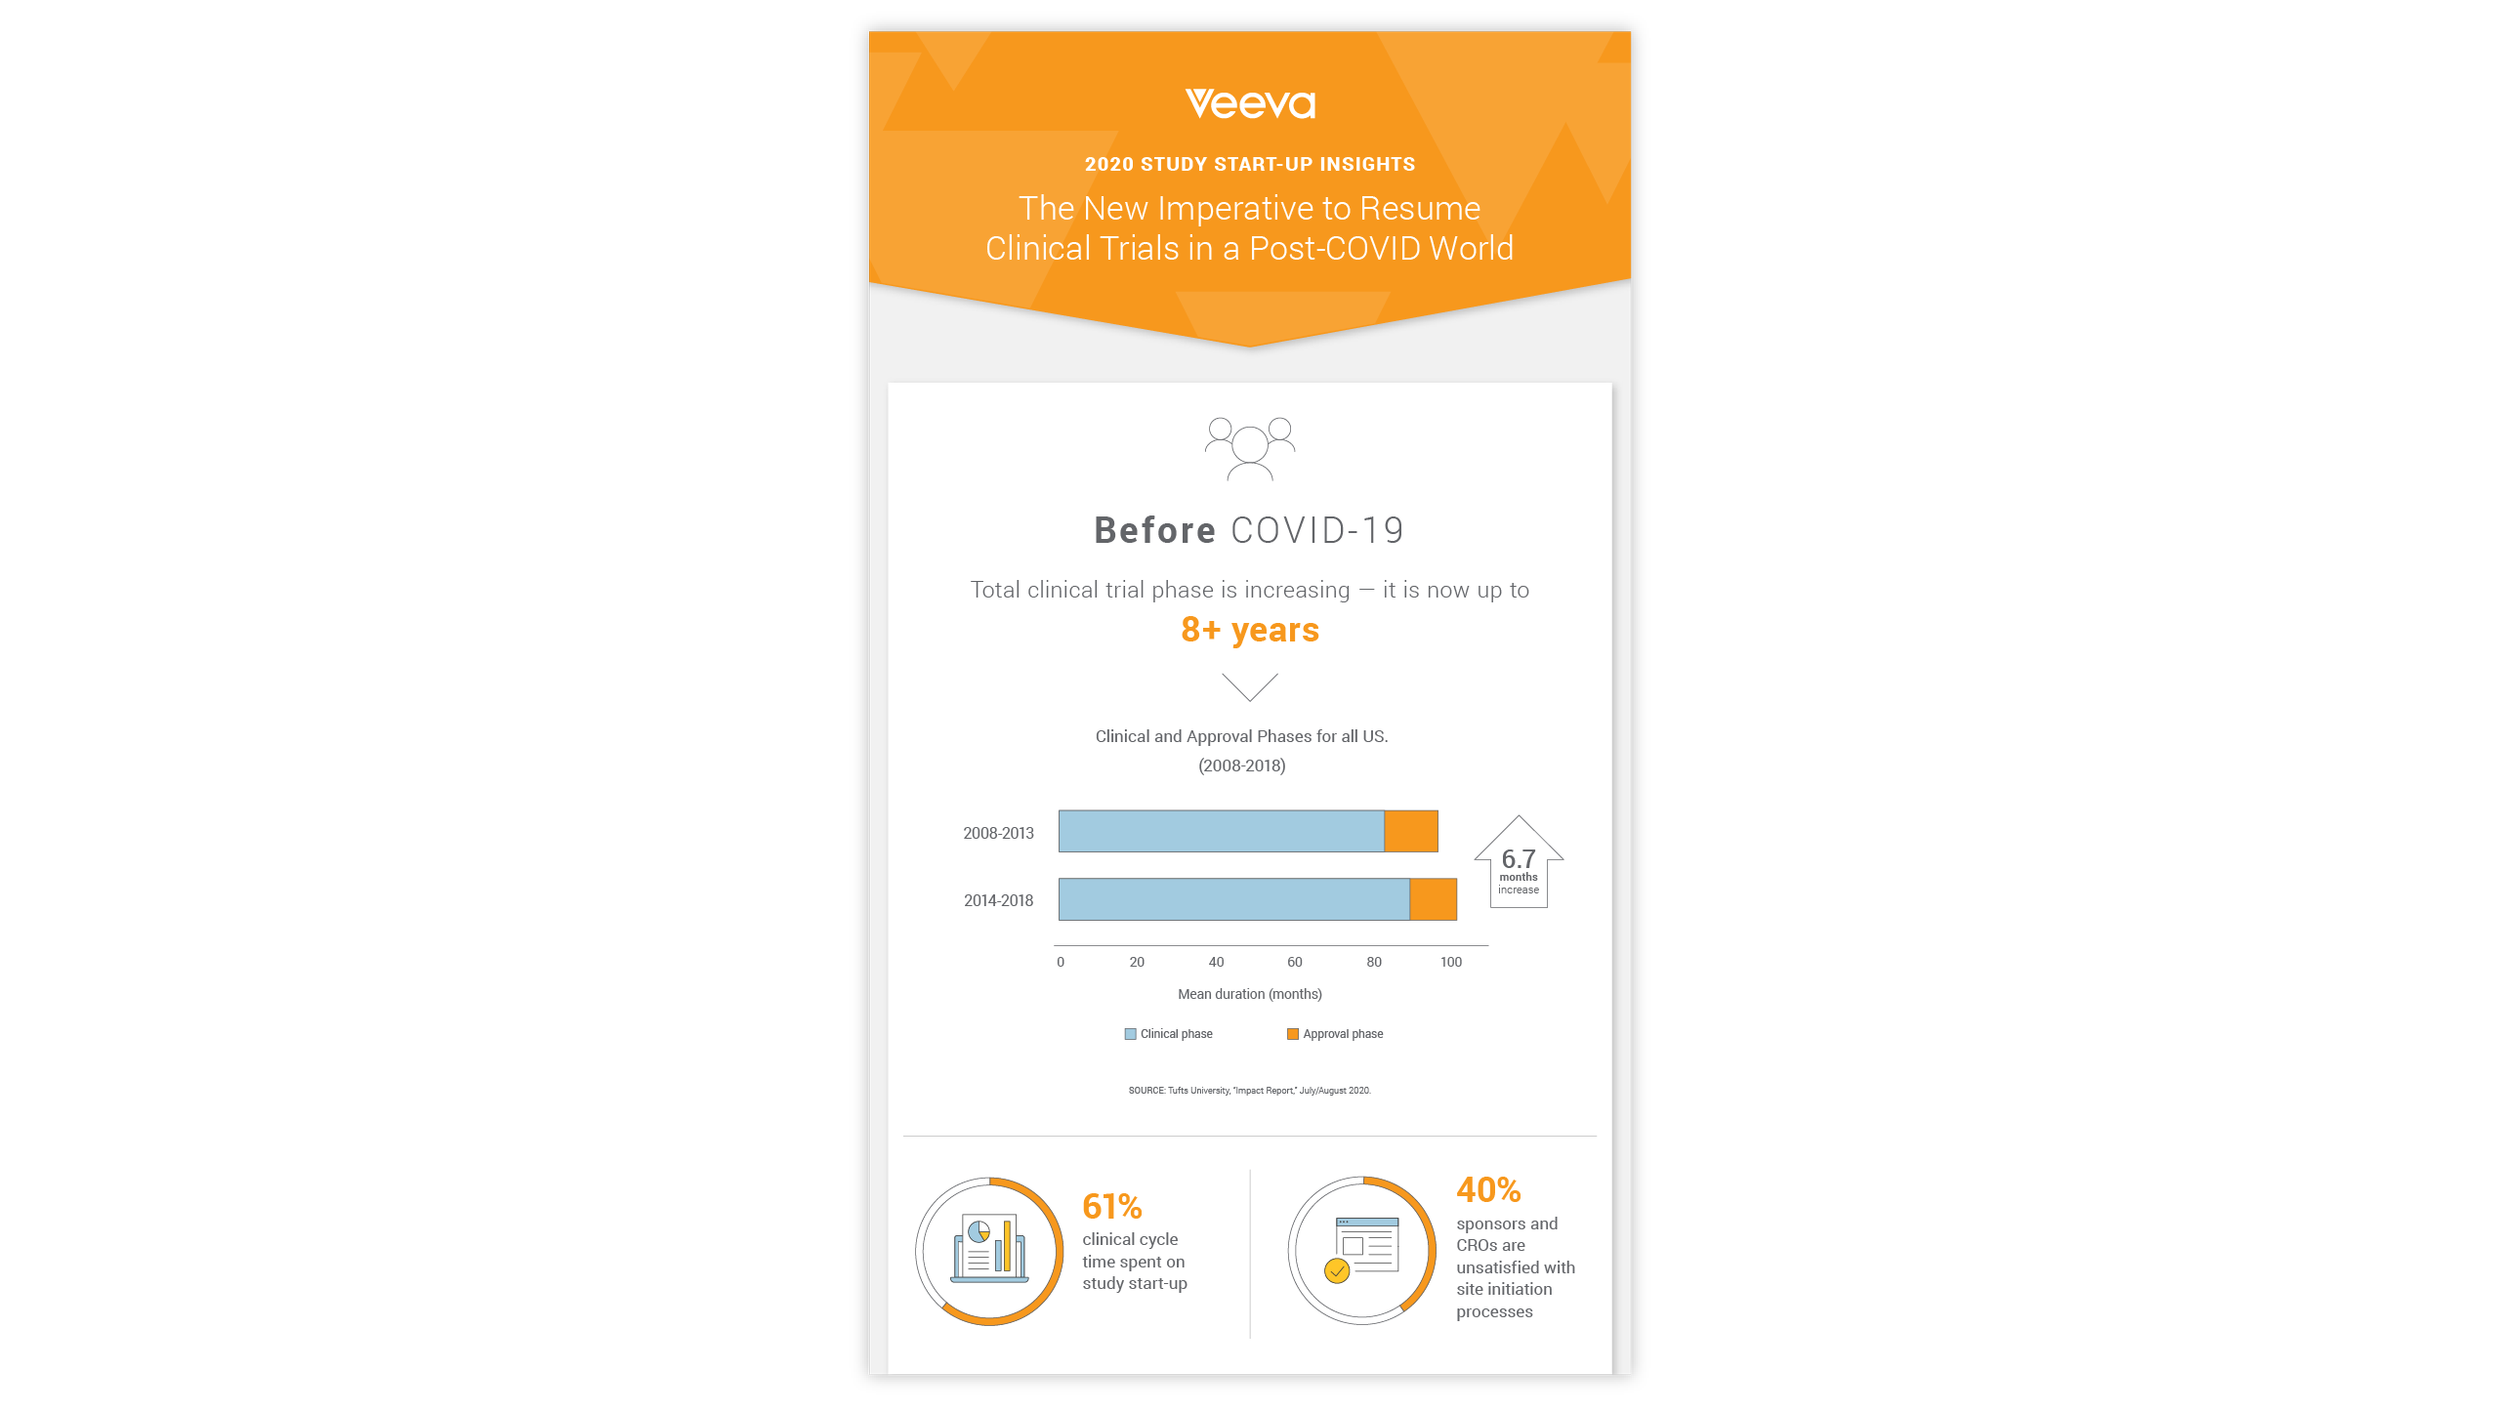
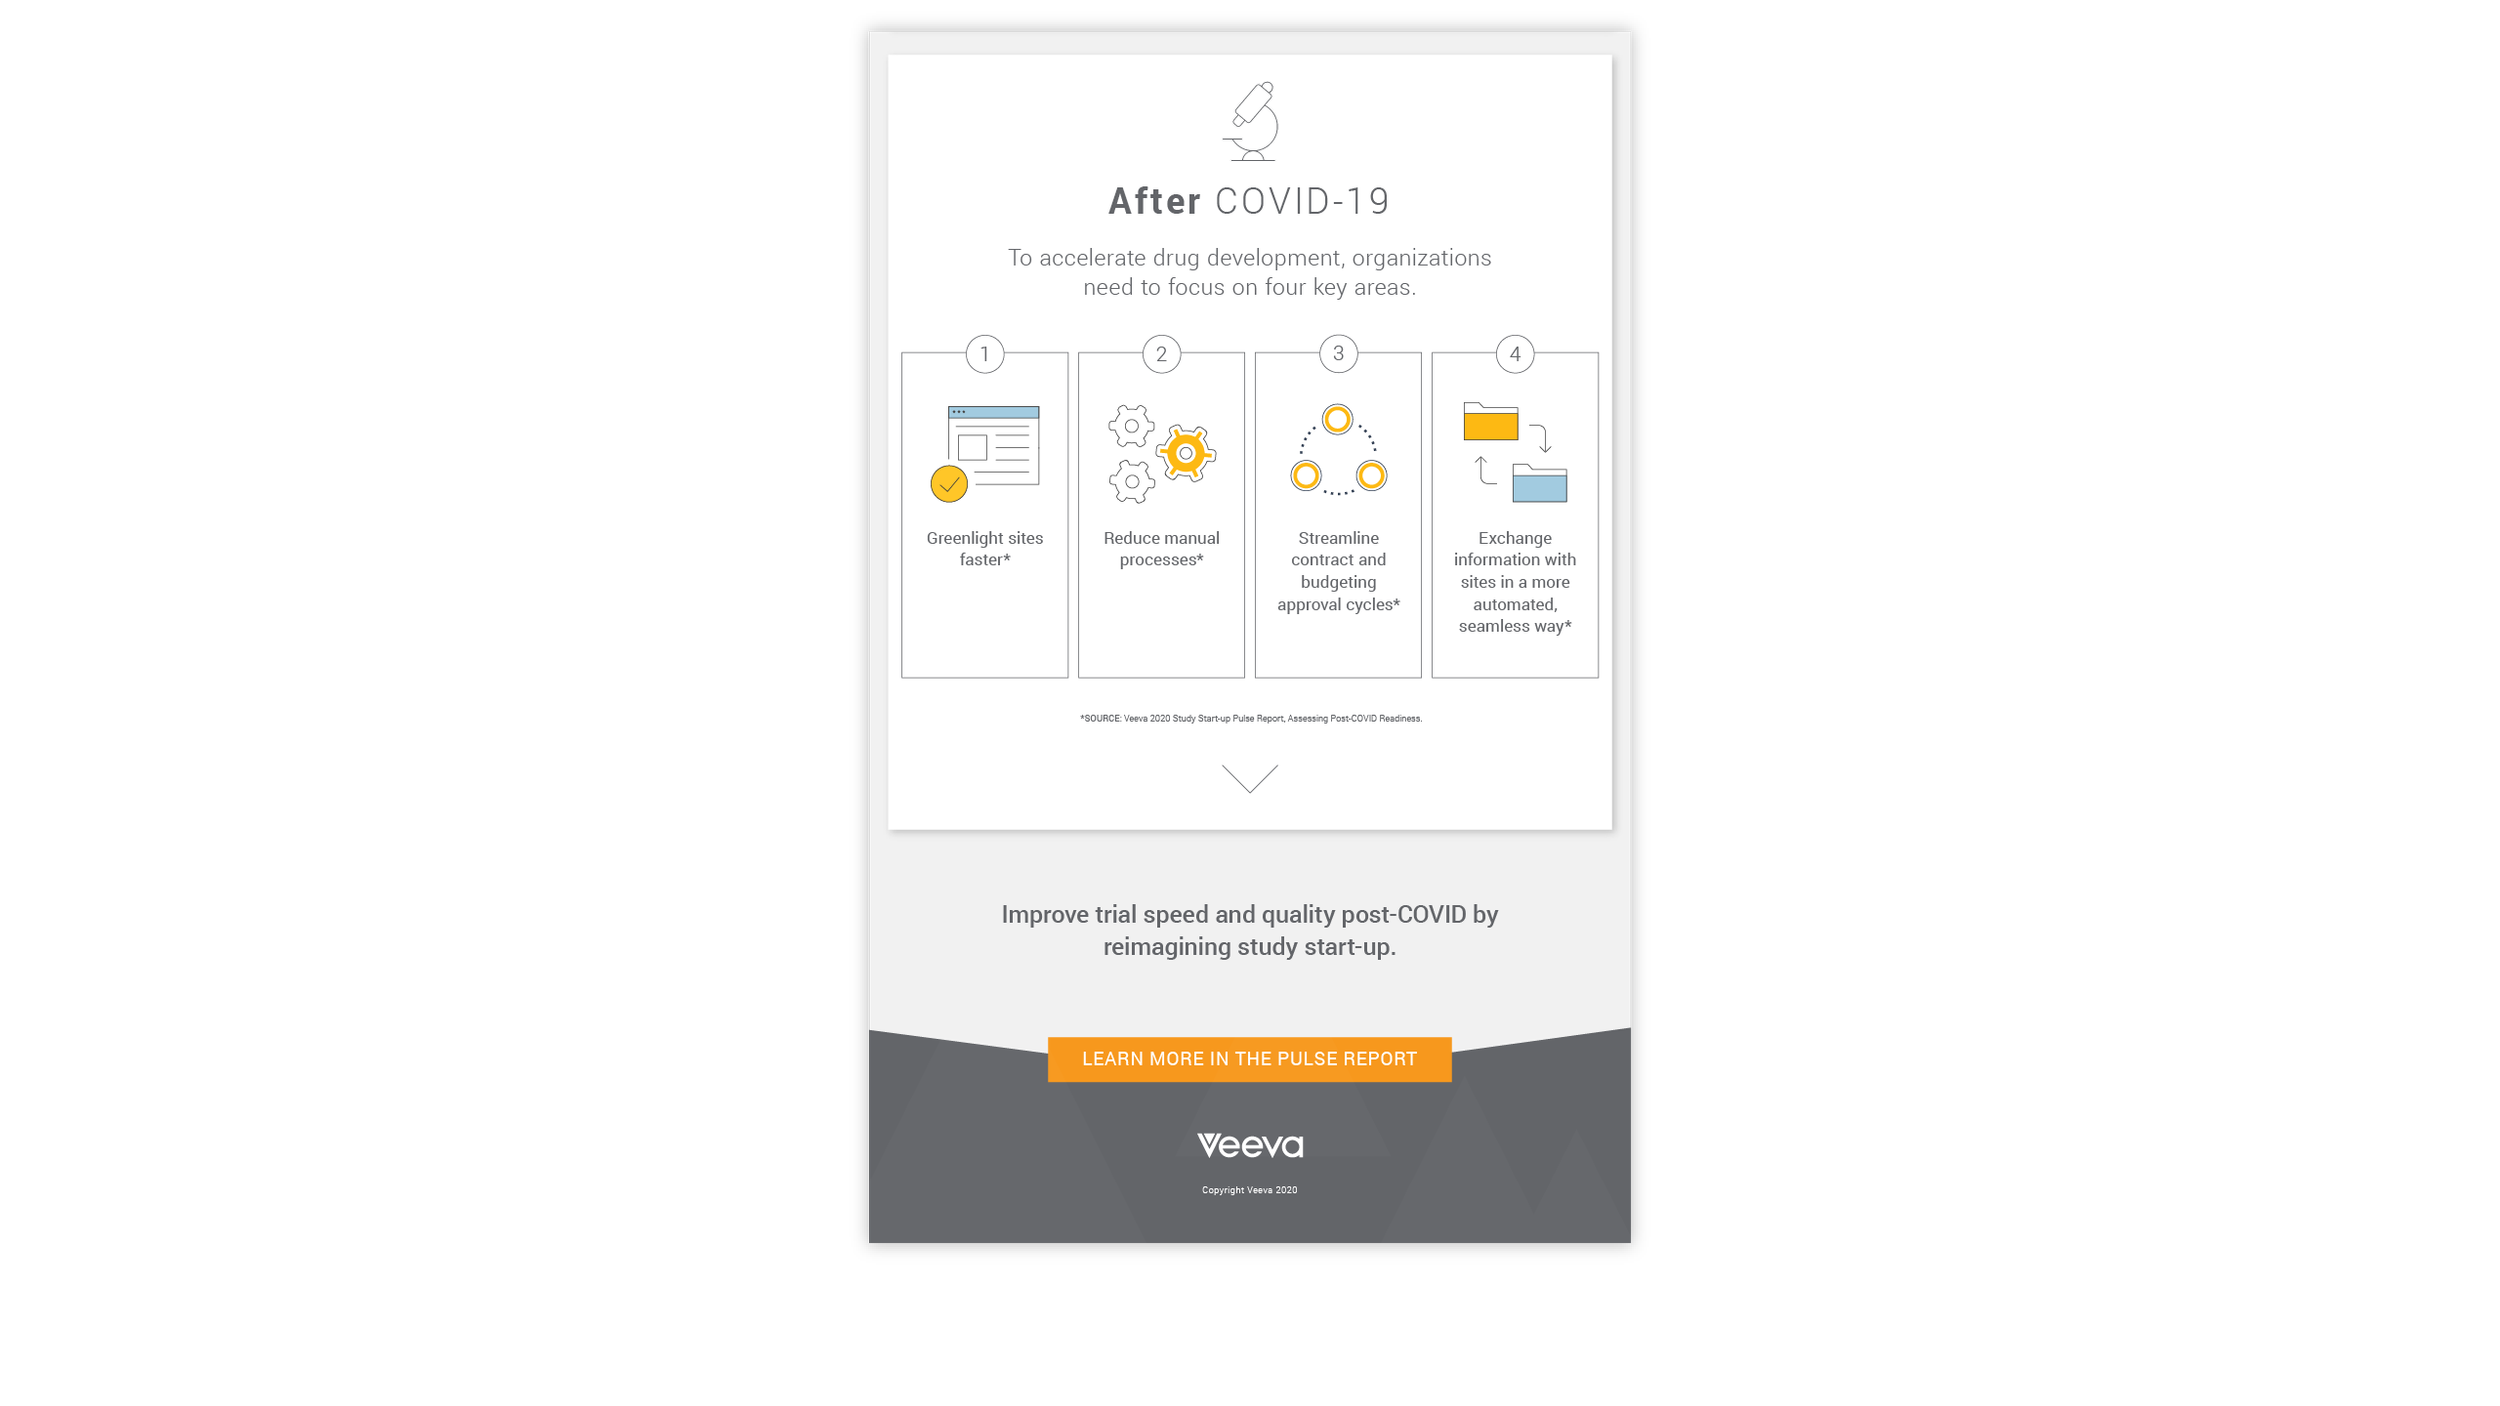
In 2021, Veeva wanted to communicate their most comprehensive COVID-19 insights to date. The raw content was provided to me in a Word document, which I then re-organized to create the three main sections (Before, During, and After) to more effectively tell the story. Finally, I used Illustrator, to visually represent the data in Veeva’s branding.
PROGRAM:
Adobe Illustrator
FINAL DESIGN


